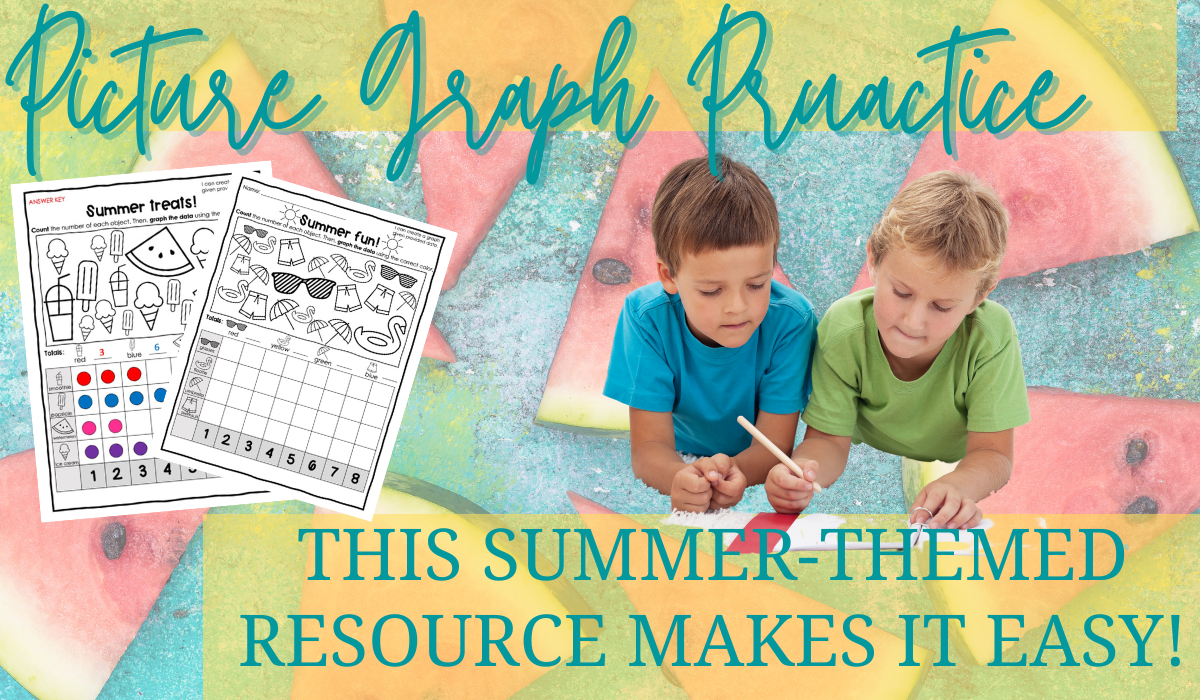
Looking for a way to make picture graph practice fun for your elementary students? Look no further than these worksheets, designed to engage and educate.
Picture graphs are a great way to introduce elementary students to the world of data and statistics. But how do you make practicing picture graphs fun and engaging? These worksheets are designed to do just that, with colorful graphics and interactive activities that will keep your students interested and learning.
Introduction to Picture Graphs
Why do we use pictographs?
As you know, picture graphs are a type of graph that uses pictures or symbols to represent data. They are often used to show how many of something there are, or how much of something there is. For example, a picture graph could show how many apples and oranges were sold at a fruit stand, or how many students in a class prefer different types of pizza toppings. Picture graphs are a great way to make data more visual and easier to understand for elementary students.
Picture graphs are also the precursor to the more abstract bar, line, and pie graphs students will learn in later grades. Teaching pictographs well sets a strong foundation on which your elementary students will build!
How to make a picture graph
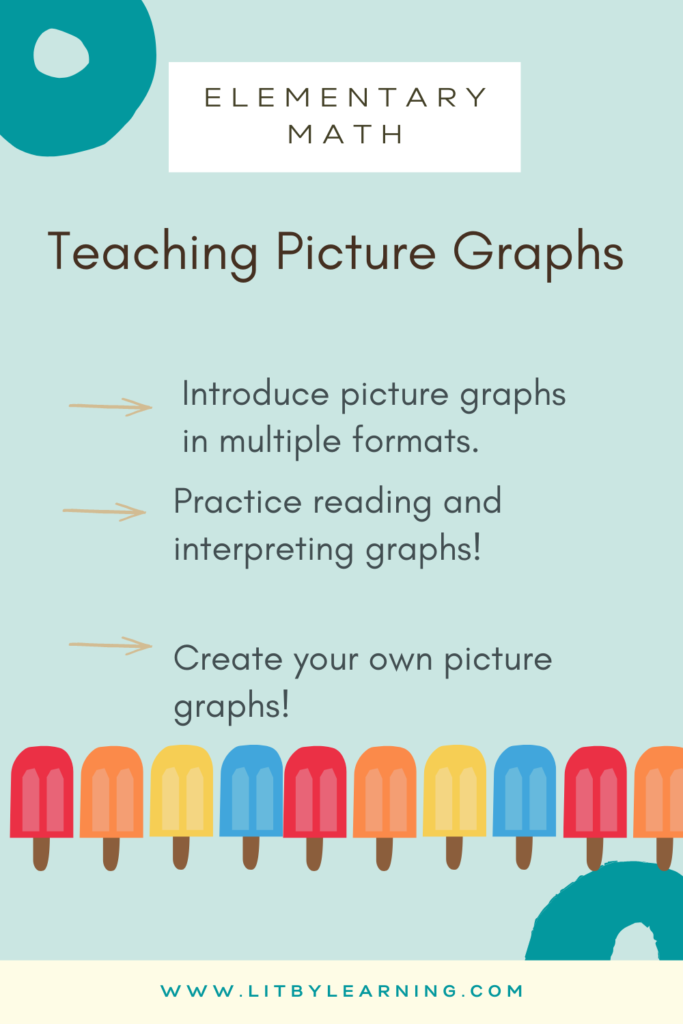
Model how to make a picture graph using some student-generated data. For example, ask your elementary students to vote on their favorite animal. Then, think aloud as you compile the data and transform it into a picture graph.
Introduce both vertical and horizontal picture graphs
When showing your elementary students examples of pictographs, make to introduce them to both the horizantal and vertical formats that a picture graph can take. Highlight how both formats are both similar and different. It could even be helpful to show how you could represent the same data set on both a horizantal and vertical picture graph!
Picture Graph Practice: Reading & Interpreting
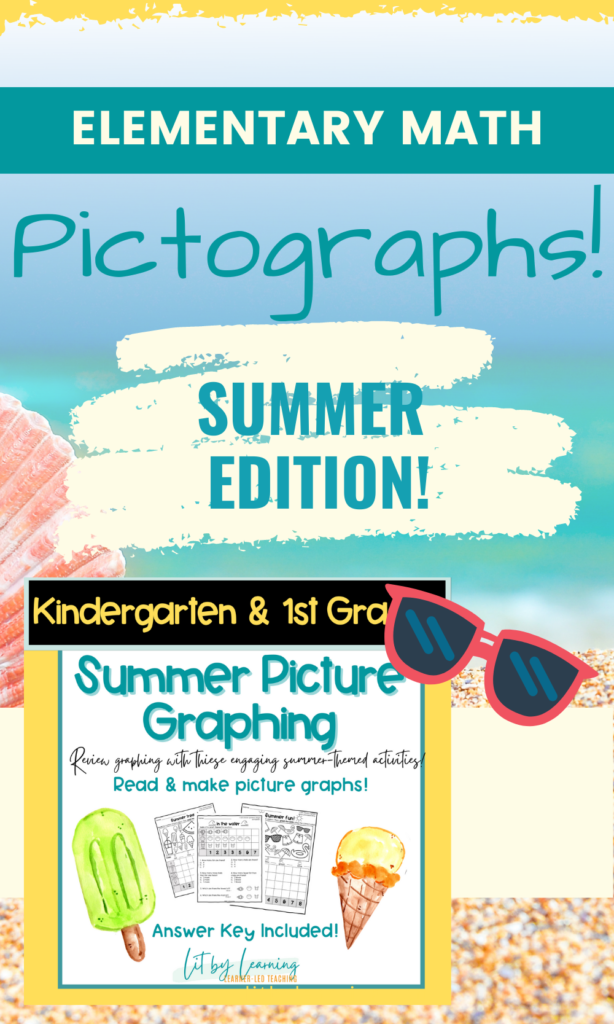
Reading and interpreting picture graphs is an important skill for elementary students to learn. These worksheets are designed to help students practice this skill in a fun and engaging way. Each worksheet includes a picture graph with questions that ask students to read and interpret the data. Students will practice counting, comparing, and analyzing data in a visual format. These worksheets are perfect for classroom use or for at-home practice!
Creating Picture Graphs from Data
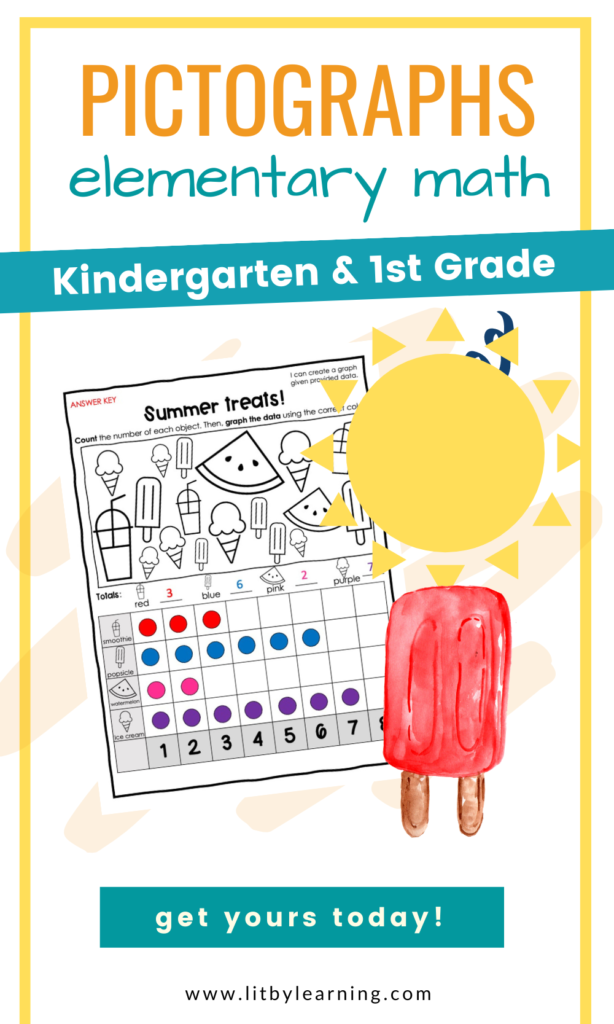
In addition to reading and interpreting picture graphs, it’s important for elementary students to learn how to create their own picture graphs from data. These worksheets include activities that ask students to collect data and create their own picture graphs to represent that data. This helps students develop a deeper understanding of how picture graphs work and how they can be used to communicate information visually. With these worksheets, students will have fun while building important math and data analysis skills.
Read more!
Check out these other blog posts by Kate from Lit By Learning!